UE Tips & Best Practices
🧠 Pre-tip! Make your own document like this one (txt file, google doc, whatever!) for things that you learn. Unreal Engine is vast with a lot of features, options, knobs, buttons and checkboxes, and it's impossible to keep them all in your head.
Sub Pages
Editor Usability
- CTRL+P or SHIFT+ALT+O quick open dialog.
- CTRL+B to go to asset.
- While navigating the viewport with right click hold + WASD, you can scroll the mouse to speed up / slow down.
- Hold CTRL to zoom in three levels further in graphs with the scroll wheel.
- Master blueprint search
- “
+” means exact match:Nodes( Name = +"SetTransform" ) Nodes(Name=PrintString) && Path=Gameplay/Enemies/MyBossParentClass=BP_EnemyWeapon && All(Name=EventTick)
- “
- Master content browser search
ParentClass=BP_EnemyWeaponVertices > 50- More details in this post.
- Use bookmarks when designing levels (ctrl+[0-9] to bookmark, [0-9] go to). Bookmarks get saved into the level and shared with team members.
- Spline Generation Panel is a super fast and convenient way to make basic spline shapes.
- In editor, ALT+F to toggle fog visibility, G to toggle between editor/game view, T to toggle translucent selection.
- ALT+R to toggle light radius indicator.
- Use the Property Matrix for multi-asset editing.
- Use developer folders for content you want synced to version control, but not shipped as a part of the project.
- Use the “Show C++ / Engine content / developer folders / plugin content” options in the content browser as needed.
- Right click .uproject file -> launch game, or launch the editor with “-game” parameter from VS or command line to open without (most) Editor overhead without the need to make a build (doesn't count as a PIE session).
- You don’t need to make a full packaged build to test your non-editor build. In Unreal Editor simply select Platforms → Windows → Cook Content, close the editor, and then start the game from Visual Studio in any non-editor configuration (like
Developmentinstead ofDevelopment Editor). - To set your personal editor startup map:
Editor Preferences→General→Loading & Saving→Startup→Load Level at Startup: Last Opened vs Project Default vs Empty. Doesn't affect other people on the project. - To control if the PIE game gets mouse control by default:
Editor Preferences→Level Editor Play→Game Gets Mouse Control. - You can set an asset to be scaled/rotated/positioned in the world or relative by clicking the arrow next to the property.
- To show editor framerate, memory and UObject count at the top of the editor window:
Editor Preferences→General→Performance→Show Frame Rate and Memory. - To change which BP nodes are created by default in new blueprints (Event BeginPlay etc.), override
[DefaultEventNodes] NodeinDefaultEditorPerProjectUserSettings.ini(see defaults inBaseEditorPerProjectUserSettings.ini). - To be able to inspect components that were only added to an actor during runtime, uncheck
Editor Preferences->Content Editors->Blueprint Editor->Hide Construction Script Components in Details View. Image with example. - For coders: every time you launch the game / editor from Visual Studio it will spend time loading symbols for every single loaded module. You can disable that functionality by setting automatic symbol loading to
Only specified modulesand to turn offAlways load symbols located next to modulesin VS.- Breakpoints won't be hit for modules without loaded symbols, but you can add those modules to the
Only specified modulessetting. - You can load a module's symbols in VS's Modules window or in the Call Stack.
- See more on the bottom half of this post.
- Breakpoints won't be hit for modules without loaded symbols, but you can add those modules to the
- Tilde (~) is the default key to open the console in game projects (the button under Escape). Larger countries using other locals have overrides for their own keyboards by default in UE but if your non-US keyboard’s button doesn’t work you can rebind it for all games on your computer:
My Documents/Unreal Engine/Engine/Config/UserInput.ini:[/Script/Engine.InputSettings] +ConsoleKeys=Insert(or any other button you prefer). - To make BP windows always dock by default in all projects on a certain computer, create
My Documents/Unreal Engine/Engine/Config/UserEditorPerProjectUserSettings.iniand put[/Script/UnrealEd.EditorStyleSettings] AssetEditorOpenLocation=MainWindowinto it. Note: The category was[/Script/**EditorStyle**.EditorStyleSettings]before 5.1. - Disable “NTFS Last Access Time” to get a bit more performance out of Windows’ file operations.
- Start cmd with admin privileges and run
fsutil behavior set disablelastaccess 3. You can restore it by runningfsutil behavior set disablelastaccess 2. - Unreal now has a plugin that will notify you if this is on; enable the Editor System Configuration Assistant plugin for the project so anyone on the team gets notified if they have Last Access Time enabled with a quick fix button in UE.
- Start cmd with admin privileges and run
Extending the Editor
- Use Editor Utility Widgets to create your own editor panels easily in Blueprints and UMG.
- You can extend editor menus and toolbars in BP by subclassing
EditorUtilityToolMenuEntry. See how here.- Another way of seeing the extension points is by checking
Editor Preferences→General→Miscellaneous→Developer Tools→Display UI Extension Points(requires restart). See how here.
- Another way of seeing the extension points is by checking
Performance
- You need to watch these two presentations:
Epic(the default) scalability is generally tuned by Epic Games to be run at 30fps on new-gen platforms or high end PCs.Highis tuned to be run at 60fps. You’re going to have a really up-hill battle if you try to tuneEpicscalability to run at 60fps. Source.- Use “Tick on Render Only” when you can.
- Not everything has to tick every frame, specially not if it's further away or not visible.
- Blueprints tick during
PrePhysicsTick Group by default. Move the tick to beDuringPhysicsif you don’t need to read or set any transforms or collisions to best optimize your frame time. - Take advantage of the Significance Manager.
- If a mesh doesn't need complex physics, use simple physics for it.
- If a mesh doesn't need a physics mesh, disable it.
- Construction scripts only run when in editor or when cooking (except when spawning those actors dynamically) and get serialized into the level, they can do heavy stuff that you don't want to hit performance during playtime.
- Your game thread is sacred, don't block it. If you manage to not block it even when loading then you'll be able to load parts of your game without hitches meaning you can do it while other content is running (like Spiderman's subway scene, or hiding loading screens via a video, or even during gameplay).
- If you want to do calculations in a different thread, try to avoid creating or manipulating UObjects unless you know the GC intricacies in regards to threading (i.e. Async flag preventing collection, lifetimes and locks). It’s safest to use FStructs with no UObjects, and then convert the results to UE land on the Game thread.
- Keep your UObject count low, if there's too many of them it slows down garbage collection. Use obj commands like
obj listwithobj list class=xxto hunt down offenders. See more about Garbage Collection performance and troubleshooting in ‣.- You can add -CountSort to sort by uobject count.
- A big AAA game should be able to keep under 300k objects in a packaged game.
- Consider doing a Profile Guided Optimization build for your game. Not many do this though, your mileage may vary.
- If you have a lot of trigger volumes only for the player, consider making PlayerOnly collision instead of colliding with everything and then casting to player to check if you’ve hit them. Source.
- An excellent presentation about managing physics collision settings and queries.
Conventions
- Use the Size Map (right click an asset, “Size Map”) to see how much an asset would load in through dependencies.
- Unreal's internal asset paths always start with
/Game(or/PluginName) even though the folder on your drive is called/Content. - Don’t use widget bindings, use event dispatchers.
- Check out the new ViewModel plugin as a preferred way of sending data to widgets.
- Use and extend the Cheat Manager.
- Use
#if UE_WITH_CHEAT_MANAGERto strip out cheat functions you don't even want compiled into shipping builds. - Be able to start the game from any map. Structure your blueprints and managers to enable that. It's immensely useful to be able to jump into any part of your game and just start playing.
- Use data validators, you can also make them in blueprints. (Documentation, Twitter thread with an example)
UObject::IsDataValidapparently also works.- Turn on
bValidateAssetsWhileSavingForCookto have the validators run during cook time. - DefaultEditor.ini:
[/Script/DataValidation.DataValidationSettings] bValidateOnSave=true(Runs validation when saving the assets, recommended)[/Script/DataValidation.EditorValidatorSubsystem] bValidateAssetsWhileSavingForCook=true(runs validation when cooking the game, recommended)bAllowBlueprintValidators=true(allows you to create validators in blueprints if you want to)
- Keep performance in check throughout the whole project, it makes development easier. Specially for designers re: balancing.
- Delete assets you don’t need. They take space, make upgrading UE versions hard, can break when parent BP or code changes, and take time during DDC cooking.
- Consider disabling “
Allow tick before play” on actors. - Don't load assets via hardcoded C++ code paths, use
UPROPERTIESor Primary Assets instead. And especially never load assets in class C++ constructors using ConstructorHelpers, they get loaded super early on and get added to "Disregard for GC" list and will never get garbage collected. They'll also cause crashes if they ever reference non-disregard-for-gc assets at any time later in the game's lifetime. More on this in Loading assets in C++. DestroyandEndPlayalso get called on actors when switching levels, closing the game, or ending the PIE session. Consider adding aGetWorld()->bIsTearingDownguard to skip doing unnecessary work (like spawning new actors) when that happens, that is true if the EndPlay function was called while exiting PIE or otherwise quitting the game.- Always pair
BeginPlaywithEndPlay(notOnDestroy) as actors can have their visibility toggled on and off on a level-wide scale before Destroy gets called. So yes,BeginPlaycan be called multiple times, but it will always be paired with a call toEndPlay. - Keep your redirectors in check.
- Show redirectors in your content browser and remember to fix them up every once in a while.
- For larger teams, fixing up redirectors might be dangerous as uncommitted changes might still reference them. Keep redirectors around and only clean them up right after running ResavePackagesCommandlet around holidays when teams aren’t committing much, which fixes references to them in all assets.
Cooking
- By default, nothing is marked to be cooked. But also by default, if nothing is marked to be cooked, then everything is marked to be cooked. This can severely bloat your game as unreferenced asset will also be included into your build. Twitter thread with info.
- In the
Project Settings→Game→Asset Manager→PrimaryAssetTypesToScanarray, you can change theCookRulefor Maps to beAlwaysCookand disableEditorOnly. This makes it so that only maps in the/Content/Mapsfolder (and/or any other folder you define in that rule) will get cooked alongside any other asset they reference. This is the best option in my opinion. - Creating a new
PrimaryAssetTypesToScanrule withCookRuleset toAlwaysCookis also enough to prevent everything from cooking, as long as it of course adds actual assets. - If you want to have all maps in your entire game cooked (no matter which folder or plugin) alongside any other asset they reference, then you can alternatively just enable
Project Settings→Project→Packaging→Advanced→Cook Only Maps (this only affects cookall). You’ll need to enableCookAllalso, otherwise this setting gets ignored if you manually add any assets to get cooked. - Lastly, and what bigger projects/studios often do, is to override the
AssetManagerclass to have more detailed control over their asset management and cooking. If theAssetManageradds any assets to be cooked then the default behavior is prevented.
- In the
- Don’t use
DirectoriesToAlwaysCookto cook whole folders unless it’s raw data only loaded from code. Instead define your dynamically loaded assets as Primary Assets.- You can also use
UAssetManagerand override it to fit your needs (not all projects find a need to though). - For whole folders you can use
Primary Asset Labels.
- You can also use
- Only use Iterative cooking when making changes to blueprints locally. Don't do it on your CI build server, it's not super stable, specially if code changes.
- We’re working on a new true Incremental Cooking system for Unreal 5.5+. See more here.
- Keep your cooks deterministic. Blueprint constructors should especially be deterministic. If you need randomization, make it based on a seed or some other static info like the actor's position. Your builds won't differ with the same assets and it will be easier to do updates using the assets' file hashes like some platforms do.
- Find a way to make a "small subset" cook (i.e. I only want to cook the test level and enough assets to run it), will help immensely when the game grows and you need to figure out "only in cooked builds" issues. Usually done by only cooking some maps, make sure references are in order and don't "pull in" the rest of the game.
- This will be less of an issue when Incremental Cooking is ready.
- To cook a single map or even a single asset,
run=cook -targetplatform=<platform> -cooksinglepackagenorefs -map=<map or asset path>. Source. - To get the cooker to log which assets are being cooked, and which dependency triggered it, which helps knowing which assets errors and warnings come from, do one of these:
Project Settings→Engine→Cooker→Cooker→Cooker Progress Display Mode=Instigators and Names (and Count).- DefaultEngine.ini:
[Script/UnrealEd.CookOnTheFlyServer] cook.displaymode=6 - Launch option:
-ExecCmds="cook.displaymode 6" - Console command:
cook.displaymode=6(0: No display, 1: Display packages remaining (count), 2: Display each package by name, 3: Names & Count, 4: Instigators, 5: Instigators & Count, 6: Instigators & Names, 7: Instigators & Names & Count) - If you have some test maps that you don't intend to ship with the game, don't put them into the /Maps folder. Projects usually mark all maps in that folder to get cooked. Put them in some other folder, and even better, put them into a folder marked in
DirectoriesToNeverCookin config. - You can add the
MetapropertyUntrackedto aSoftObjectPointer/SoftClassPointerto make it not count as a dependency.- You can modify the engine to support
Untrackedarrays and to enable users to do it in the BP editor with this: ‣ .
- You can modify the engine to support
Project Setup
- For projects building UE from source, your project folder should be in the same parent folder of the Unreal Engine you're using to be considered a "Native Project" (sometimes called "non-foreign" in documentation). If it's elsewhere it's considered a "foreign" (or non-native), project which doesn't work with as many build tools (like Horde) as a native one. More info here. (I've personally noticed troubles with incremental cooking on foreign projects). The preferred structure then for a proper “native” project would be: 📂
ParentFolder_P4 - 📁
Engine - 📁
Project1 - 📁
ProjectN - Follow ue4.style project style guide.
- Check out Linter v2.
- Follow Epic's coding standard.
- Make use of the Crash Reporter to get crashes sent to you.
- Check out services like Sentry, Backtrace, BugSplat, BugSnag (Android/iOS/Switch only) that allow you to handle the data out of the box. See how in this presentation.
- Note that the crash reporter is configured in
GameName\Engine\Programs\CrashReportClient\Config\DefaultEngine.ini, not in your game's config directory. (not 100% sure if this is still true)
- Set up antivirus exceptions for work folders (or work drive) for improved speed.
- Connect UE editor to source control for asset locking. Perforce/Plastic/SVN are all good choices. Git is not unless you’re working solo.
- Turn on “Promote Output Log Warnings During PIE” to easily catch warnings.
- Use the developer folders for assets that shouldn't ship. Mark the folder as NeverCook in the project settings.
- Consider using Unreal Game Sync (UGS) as a Perforce front-end for your project. That’s the “Unreal” way and how most AAA studios use it.
Building
- When compiling the editor, you rarely want to make an “Installed Build” of the editor as it’s veeeeery time consuming (hours), you need to compile the Engine and every single plugin in every configuration for every platform which takes forever. Instead use UnrealGameSync (how Epic and AAA studios do it) or just compile your project directly from Visual Studio which also only compiles the editor for your one platform and configuration (minutes).
- Add “
-buildmachine -nocodesign” or just “-showallwarnings” to get a dump of all cook/build warnings/errors at the end of the log. Otherwise it will cap them after a certain count. - Version your editor and game binaries. Perforce builds via UGS do it automatically.
- Use the
DevelopmentAssetRegistry.binto report on a cooked game size, you can feed it into the Asset Audit window. - In general when compiling C++ code or cooking, your computer should have 2GB of memory per hardware thread.
- Unreal Build Tool only uses one process per 1.5GB of free memory when compiling. For an 8 core processor, it will only fully utilize all 8 cores if you have at least 12GB of free memory, 24GB in case of hyperthreading.
- Usually you should always build the editor as
Development Editor. You can also useDebugGame Editorif your code gets too optimized to debug.- Only do
Debug Editorfor very heavy hardcore engine debugging, I even rarely need that one. Caution, it will make everything in the editor super slow. - Check out more tips in the Debugging section on disabling optimizations for specific files or modules.
- Only do
- You can use
PreBuildStepsandPostBuildStepsin your*.Target.csfile to add custom pre- or post- build steps/hooks. Check the comments on those properties for more info. Be aware that these are only run when the C++ project is built, if you package your project and nothing needs rebuilding, these won’t be run. Also consider putting those extra steps into a BuildGraph file if you use that to build from your CI servers.- You can make UGS do custom build steps also which might be a better choice.
Content Creation
- Consider using the Gameplay Ability System.
- Consider using Game Feature Plugins.
- Consider using UE’s in-editor sculpting tools for level gray-boxing.
- Autosave is good, it saves as a backup copy, not the asset itself.
- Use soft references and interfaces!
- In C++, soft references have comparison operator overload for UClass, so you can check if a
TArrayof soft references contains aUClass. - Soft Object References can point to other actors in other (sub)levels even if they're not loaded. This is a huge thing!
- Do NOT make variables of the types
Soft Class PathorSoft Object Path, useObject→Soft Object/Class Referenceinstead. - More info on ‣.
- In C++, soft references have comparison operator overload for UClass, so you can check if a
- Don’t let temp stuff get to the playtest without an easy way of finding it later.
- Use “Editor only”.
- No rude / copyrighted temp stuff ever! You'd be surprised how easily those get forgotten and shipped.
- Actors can exist without a root component, good for managers that don't need a transform. Just null the root component in the C++ constructor or extend
AInfo. - Make your materials and other assets take into account the quality settings (Medium, Epic, etc)
- Tired of those default white spheres all empty actors have? Replace the
DefaultRootComponentwith a normal plainScene Componentand it will disappear. - Use core redirects (class, property, etc redirectors) instead of having to edit lots of old assets when replacing a class with something else.
- Reduce shader permutations in your project settings to reduce compiled shaders.
- Use the
AssetRegistrySearchableflag to add query-able properties to assets via Asset Manager without having to load them first. - Take persistence into account early, where parts/levels of your game need to load out and in again and enemies/items/world state needs to be saved/restored.
- Consider using Level Streaming Persistence plugin instead of writing your own.
- Blending between gameplay and cinematic camera is possible, but quite unintuitive if you don't know what to look for. Instructions here.
Code
- Install UnrealVS Visual Studio extension to be able to easily modify and toggle between previous application startup parameters. Great for quickly adding
-game,-ExecCmds="", etc..- Rider also has great UE support nowadays as a VS alternative, although I’ve found that Visual Studio 2022 is actually quite good these days without Visual Assist or similar.
- Install the “Visual Studio Tools for Unreal Engine” component in the Visual Studio Installer to get BP support which shows you BP references in code. Rider already has this built in.
- Set the environmental variable “
UE_NAME_PROJECT_AFTER_FOLDER=1” to have the solution file named after the parent folder instead of the default “UE5.sln”. Great when you have multiple projects on your computer.- You can alternatively add
<ProjectFileGenerator><bPrimaryProjectNameFromFolder>true</..>to your BuildConfiguration.xml file.
- You can alternatively add
- Microsoft has a great video on setting up Visual Studio for UE development here.
- Try to avoid using the STD framework. UE has its own equivalents for most.
- Actor.h has a nice reference comment on the important overridable virtual functions of an Actor’s initialization, see here.
- Use
GENERATED_BODY(), notGENERATED_UCLASS_BODY()orGENERATED USTRUCT_BODY(), they’re legacy. - Use a normal constructor:
AMyClassName(), not the one with object initializer, that one’s legacy. - Your code should also compile with PCHs off and without Unity builds. See more in the ‣ video.
- Know the difference between
#if WITH_EDITOR(only runs in editor) and#if WITH_EDITOR_DATA(only for editor-only class properties, skips cooking them). #ifdef WITH_EDITORis incorrect,#if WITH_EDITORis correct.WITH_EDITORis always defined, but it's either 0 or 1.- Always decorate your member variables that point to
UObjects withUPROPERTY(). Otherwise they'll point to trash data if the garbage collector runs, as it doesn't null non-uproperty variables for you.- Use “
Transient” when you don’t want it serialized / saved with your asset. - Use
TWeakObjectPtr<T>when you don’t want it to keep a reference alive, then you don't need to useUPROPERTY. See more in ‣.
- Use “
- Know how to use ‣.
- Use subsystems.
- Know the difference between an
F(StructOfAnyType),UObjectandAActorlifetimes and GC.- You manage the lifetime of
F(StructOfAnyType)yourself and is what you used with smart pointers likeUniquePtrandSharedPtr. UObjectscan only be destroyed by the garbage collector when nothing references them anymore, or (rarely) if you've addedPendingKillflag to it. Never use lifetime-managing smart pointers likeUniquePtrorSharedPtron them.AActorsare fancy UObjects and can beDestroy()-ed, which removes them from the world but still waits for the garbage collector to finish cleaning it up. That's why you need to useIsValid()to check if an Actor is valid.
- You manage the lifetime of
- Understand how the CDO works.
- For C++ constructors, only code for describing the CDO should go there (setting up the object, its components, subobjects, defaults, etc). Nothing else.
- Don’t register delegates in there, CDO shouldn't probably be doing anything and (unless they're transient) they get serialized (dynamic delegate) and hard to remove.
TArrayscan use stack allocators.- Use live coding.
- Use UE’s C++ snippets.
- Use
TitlePropertyUPROPERTYspecifier to make arrays easier to read in blueprints. - Use the
OverloadNameUPROPERTYmetaspecifier to add overloads to BP-exposed functions. See example. - Consider turning off
Automatically Compile Newly Added C++ ClassesinEditor Preferences->Miscellaneoustab. Usually you only want to compile them after modifying them first. - If you need to build some big dataset inside UE with thread tasks, then it is much better to use
TChunkedArrayto collect them instead ofTArray. - Use “
UPARAM(ref) UMyObjectType*& MyObjectParam” format to make a blueprint parameter mandatory. - If you add comments to
UENUMentries in code, remember to put them on a separate line above. If you comment on the same line Unreal will parse them wrong and generate off-by-one tooltips. - Never add listeners to dynamic delegates (or any for that matter) in the C++ constructor, it will get serialized into the UPROPERTY. Delegates should be registered to instead in
BeginPlay.- To fix it if it already happened, make the delegate UPROPERTY
Transientand re-save the assets.
- To fix it if it already happened, make the delegate UPROPERTY
- Don't use blocking loading function calls at all (unless in editor tools), especially when asynchronously loading other assets as it forces a blocking flush of them.
- In addition to our own docs, there are great 3rd party resources on UPROPERTY and META specifiers like ben🌱ui's site and Unrealistic.dev's Spectacle.
Blueprints
- Drag a variable over an existing get/set node for another variable to replace it.
- Blueprints have a “Save on Compile” option.
- Allow blueprints to be recompiled while playing in editor via “
Base Classes to Allow Recompiling During Play in Editor” editor setting. - You can hide unwanted pins in a struct after break. You can't do this in break structs with the green title though.
- Hold CTRL while dragging a pin to move multi-connection pins.
- Use blueprint node creation keyboard shortcuts like
A(array get node),B(branch),C(comment),D(Delay),F(foreach),P(begin play).- Create your own shortcuts with
[BlueprintSpawnNodes] +Node=[..]inDefaultEditorPerProjectUserSettings.ini(see defaults inBaseEditorPerProjectUserSettings.ini).
- Create your own shortcuts with
- You can diff blueprints. You can also diff level blueprints (file->Diff).
- Blueprint construction scripts are cooked into the levels (or run when instantiating the bp dynamically). Use it for your advantage to cook in heavy computations instead of doing them in BeginPlay.
- Turn on the setting
Blueprint Break On Exceptionsto catch and debug blueprint errors more easily. - Function input parameters in blueprints can be referenced as a local variables instead of drawing a line to them from the function node.
- If anything is referencing any function in a blueprint library, then everything the library is referencing will be hard referenced as well.
- You can make blueprint nodes be skipped by disabling them or make them development only. Enable that feature in
Editor Preferences → Content Editors → Blueprint Editor → Experimental → Allow Explicit Impure Node Disabling. You'll need to turn offProject Settings → Engine → Cooker → Compile Blueprints in Development Modefor development nodes to be disabled in shipping builds. - You can make any blueprint event callable directly from the editor in the details panel by making that event as “Call in Editor”. Great for debugging.
Materials
- Use material node creation keyboard shortcuts like
A(Add),D(Divide),I(If),M(Multiply),N(Normalize),S(Scalar parameter),T(Texture sample),U(UV),1/2/3/4(create constants ofNdimensions).- Create your own shortcuts with
[MaterialEditorSpawnNodes] +Node=[..]inDefaultEditorPerProjectUserSettings.ini(see defaults inBaseEditorPerProjectUserSettings.ini).
- Create your own shortcuts with
- You can create your own custom view mode to the buffer visualizations.
Textures
- If you are using non-alpha channels (i.e. RGB) for channel-packing data like masks and such, remember to turn off sRGB. sRGB converts the color values to Gamma 2.2 which is not the linear 0-100% value you originally put in there. The Alpha channel doesn’t have this issue, but sometimes you might want to use the RGB channels for masking or other things for better control of the compression of the channels.
- Non-streamed textures are always fully loaded in memory as long as they’re referenced. You can see if a texture is streamed or not in its properties view. UI textures are generally not streamed since we don’t want the UI to look blurry. But that means you’ll need to be careful about selectively loading in the UI in parts since you could have all UI textures in the game loaded at all times if you have references to all UI from the main UI.
- The
memreportconsole command will list all currently loaded non-streamed textures in memory in your game.
- The
Meshes
- You can add sockets to static meshes which you can then use for attachments or querying from BP/C++. Then you can have different meshes implementing the same named sockets.
Physics
- Stay on top of collision settings proactively. This presentation has a lot of greats tips on collision settings and queries, heavily recommend it: Collision Data in UE5: Practical Tips for Managing Collision Settings & Queries | Unreal Fest 2023 - YouTube
Debugging
Check out Advanced Debugging in Unreal Engine | Epic Developer Community (epicgames.com).
You can start a game from Visual Studio as if it was in another directory (good for debugging a cooked Shipping build, like one in Steam) using
-basedir=E:\path\to\GameName\Binaries\Win64. This is a really important and helpful tip, don’t just glance over it!- You can start the game or editor with
-WaitForAttachcommand-line parameter, it will then at the beginning of the startup flow halt and wait for a debugger to attach to the process before continuing. But I prefer using-basedirwhen I can instead, much better and faster workflow. - Unreal’s AutomationTool (.NET) project uses
-WaitForDebugger.
- You can start the game or editor with
[Kismet] ScriptStackOnWarnings=trueor-ScriptStackOnWarningsto show blueprint stack on warnings in the log.You can debug blueprints with the Blueprint Debugger. Open with
Tools→Debug→Blueprint Debugger. With it you can step through, into and out of BP functions.You can click F12 at any time in your packaged game or in Editor to immediately break in Visual Studio if you’re attached.
When debugging blueprints you might want to turn on
Editor Preferences→General - Experimental→Blueprints→Blueprint Break on Exceptions. This breaks your BP code in the BP Debugger on BP exceptions.You can make any blueprint event callable directly from the editor in the details panel by marking that event as
Call in Editor. Great for debugging. Can be done both for BP functions and C++ ones.When printing debugging info on the screen via the Print String BP function, give it a Key to replace an existing log line with that same key on the screen.
Always turn on symbols:
Project Settings → Project → Packaging → Project → Include Debug Files. A shipping build without debug files can't ever have its crashes debugged. But don't ship them with your game, store them yourself elsewhere like in a Symbol Server.Set up a symbol server (it's just a folder, no "server" is involved) to archive symbols for all builds. Then you can just download and debug a crash dump without hassle.
You can Source Index your symbol files. Then Visual Studio downloads the correct version of code files that you’re debugging.
- Run p4index.cmd for Perforce repos. Needs Perl installed.
- See SrcSrv - Windows drivers | Microsoft Learn for more info.
Every crash is saved to
Saved/Crashes. That's for both editor crashes and all game crashes, even shipping. It includes an xml file with lots of relevant info and a minidump file which you can drag into Visual Studio to see a breakpoint at the point of crashing (needs the debug files from the previous tip 👆).- Check my presentation Crashing With Style in Unreal Engine for crash handling and crash reporter customization.
- Include Crash Reporter with your game to enable users to upload their crashes to you (Windows only) with
Project Settings→Project→Packaging→Packaging→ (Show Advanced) →Include Crash Reporter.- Sentry, Backtrace, and BugSplat can all receive crashes directly from the Crash Reporter with only some config file changes.
- The Crash Reporter has some references to Epic which you should customize. My presentation above covers this and BugSplat also has a great tutorial on it.
- To set where the crash reporter sends the crashes to you should create this file:
STAGED_BUILD/Engine/Config/Windows/WindowsEngine.iniinto your built game directory after building your game and put this into it:[CrashReportClient] DataRouterUrl="https://your.url.here"- It’s not (currently) possible to set the Data Router URL from your project settings, you always have to create this file after each build. It’s best to automate this as part of your Continuous Integration process.
- You can make Crash Reporter send reports automatically with
DefaultEngine.ini:[CrashReportClient] bImplicitSend=true.- Confusingly enough this is in the
DefaultEngine.inifor your game project, not the one in the built one where you set theDataRouterUrlproperty. - Make sure you’re not sending any identifiable user data if you haven't gotten the user’s consent in advance. Check your local privacy laws.
- Confusingly enough this is in the
- Include Crash Reporter with your game to enable users to upload their crashes to you (Windows only) with
- You can call
FGenericCrashContext::SetGameDataat any time to set arbitrary string key/value pairs that will get saved into the crash’sCrashContext.runtime-xmlfile. - Use
FUserActivityTracking::SetActivity(FUserActivity(TEXT("In Main Menu"), EUserActivityContext::Game));to set theUserActivityHintfield inCrashContext.runtime-xml. - Crash reports are not generated when attached via a debugger. To force crash reports even when debugging, provide the
-crashreportsparameter. Good for debugging the crash flow. - Ensures (asserts) will also create a crash folder at the cost of a hitch to the game, and automatically send it via Crash Reporter, at the cost of a hitch from creating the minidump file.
- To turn that off, add
[/Script/UnrealEd.CrashReportsPrivacySettings] bSendUnattendedBugReports=falseto your game’sDefaultEngine.ini.
- To turn that off, add
- Check my presentation Crashing With Style in Unreal Engine for crash handling and crash reporter customization.
You can add additional scoped crash files with
UE_ADD_CRASH_CONTEXT_SCOPE(see example usage in UnrealEngine.cpp). Desktop platforms only.This tip bears repeating; Install UnrealVS Visual Studio extension.
Learn to do remote debugging, you can attach to the game on any computer or console on the same network (even to people's homes if they're on the same VPN).
You can make non-shipping builds wait just before crashing or asserting for a programmer to remotely attach to the process and see what's going on.
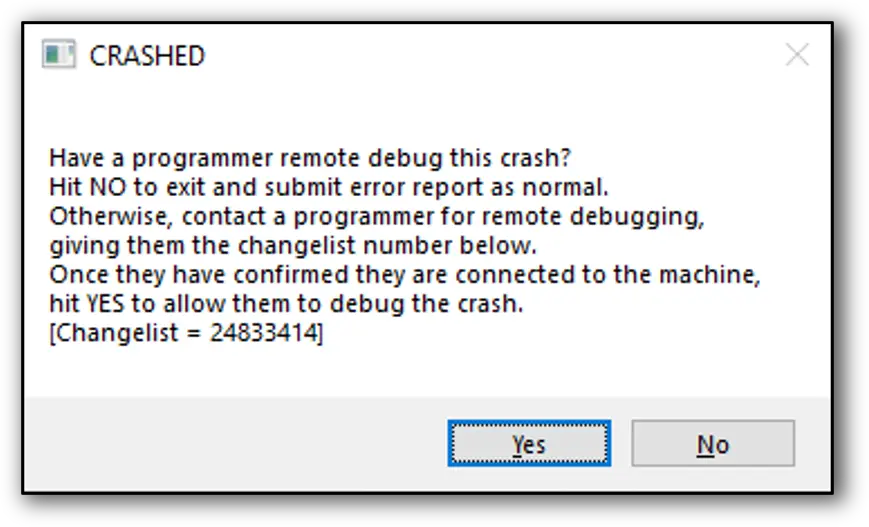
- Via config, in
DefaultEngine.ini:[Engine.ErrorHandling] bPromptForRemoteDebugging=Trueor[Engine.ErrorHandling] bPromptForRemoteDebugOnEnsure=True. - Via command line:
-PromptRemoteDebugor-PromptRemoteDebugEnsure.
- Via config, in
Support the debug camera, i.e. don't code your game so that it won't work or breaks when you switch to it.
ToggleDebugCameraconsole command.- Use the "What is This" info for debugging. See more at Advanced Debugging in Unreal Engine | Epic Developer Community (epicgames.com).
To print the current Blueprint stack while debugging in Visual Studio, in the Immediate Window type
UnrealEditor-Core!PrintScriptCallstack()for editor builds and::PrintScriptCallstack()for monolithic builds. Source.- The format
{,,UnrealEditor-Core}::PrintScriptCallstack()also works, and Rider only supports that format. - In UE4 the module is called
UE4Editor-Core. - Create an alias in Visual Studio’s Command Window:
alias bp eval UnrealEditor-Core!PrintScriptCallstack(). Then trigger with>bpin the Immediate or Console Window. The Alias will persist between runs.
- The format
To get the current Blueprint stack in code, use
FFrame::GetScriptCallstack(). It uses the stack fromFBlueprintExceptionTrackerwhich can also be used directly, i.e. to inject the stack into your own variables for debugging.- You can also call the
Stack TraceBP node to do the same thing.
- You can also call the
Quality of Life: It's super easy to have the data tips (the little data popup when you hover over variables) disappear when you just hover a little bit away from them. To keep them expanded until clicked away, go into Visual Studio options and turn on
Debugging→General→Keep expanded data tips open until clicked away.Use
TrackAsyncLoadRequests.Enable 1to capture the stack trace for every async load request, and thenTrackAsyncLoadRequests.Dumpto print all of them to the output window orTrackAsyncLoadRequests.DumpToFileto dump them into the /Saved folder. From Unreal Engine 5: New feature introduction for iteration improvements.In Visual Studio, you can create a function breakpoint based just on a function name via
Debug→New Breakpoint→Function Breakpoint (Ctrl+K, B).- You can even use wildcards like
FYourClass::*.
- You can even use wildcards like
To see what assets get loaded, when and by what:
log LogStreaming Verbose(orVeryVerbosefor even more info).- Even better, use Unreal Insights with
-trace=default,file,loadtime. - For larger projects, logging can be time consuming. You can filter the logs on specific packages by setting your selected package names or package IDs with the command
-s.VerbosePackageNames="/Game/PackageA/Game/PackageB0xABCD1234ABCD1234". Source. - If you are running with a debugger attached you can use the command
-s.DebugPackageNamesto provide an automatic breakpoint at certain load phases of the specified packages. Source.
- Even better, use Unreal Insights with
To see how long it took to load each asset, write
Loadtimes.Dumpreportinto the console. Enabled on all builds where STATS is enabled. Optionally provideFILEto write it to/Saved/LoadReports,-AlphaSortto sort alphabetically for comparing, andLOWTIME=0.05will let you set the threshold of what it outputs.- Even better, use Insights with
-trace=default,file,loadtimeand turn on the Asset Loading Tracks (L) in the Timing Insights panel.
- Even better, use Insights with
Use log commands to your advantage
-LogCmds="LogStreaming Verbose"-LogCmds="Global Error, LogCook Verbose"-LogCmds="Global None, LogCook Verbose"- Write
loginto the console so see nice documentation about the logging system.
Know what the
Outeris and how to use it.- For any actor/component/etc in a map, it's outer chain will always end in the map's
UPackage. - If you dynamically load an object (but don't instantiate it, like loading a CDO), its outermost will be that asset's UPackage.
- For instantiating an object via
NewObject, you'll have to provide an outer yourself. If you don't, it will be set toTransientPackage. - When creating a new object via blueprint, the Owner's level will become the new outer.
- For any actor/component/etc in a map, it's outer chain will always end in the map's
DrawDebugStringwill draw a temp string in the 3D world.Debug Float Historyto plot float values on a graph. Tweet.UE_VLOG_CAPSULEetcmemreport -fullare made to be diff-able. Use-logfor it to print to the output log, otherwise it gets saved into a new file in theSaved\Profiling\MemReportsfolderUse the Visual Logger.
Be aware of the different debug memory bit patterns C++ uses in debug mode (like
0xCCCCCCCC: uninitialized stack value, and0xdddddddd: already freed), more info here.if (debugCondition) { UE_DEBUG_BREAK(); }to break in the currently connected debugger.while (!FPlatformMisc::IsDebuggerPresent()); UE_DEBUG_BREAK();to wait for a debugger to attach.You can do conditional breakpoints in Visual Studio for FStrings and FNames in this format:
- FString:
wcsstr((wchar_t*)MyFString.Data.AllocatorInstance.Data, L"Search substring") - FName:
strstr(((FNameEntry&)GNameBlocksDebug[MyFName.DisplayIndex.Value >> FNameDebugVisualizer::OffsetBits][FNameDebugVisualizer::EntryStride * (MyFName.DisplayIndex.Value & FNameDebugVisualizer::OffsetMask)]).AnsiName, "Search substring") - But that’s quite the soup of characters, it’s often easier to just change the source code and make a conditional breakpoint like mentioned above:
if (MyFName.ToString().Contains("Your Substring Here")) { UE_DEBUG_BREAK(); }
- FString:
You can override any ini setting with a command line parameter for a (non-shipping) packaged build, even builds on consoles, with the
-iniexecutable argument:-ini:Game:[/Script/ModuleName.ClassName]:ConfigVarName=NewValue- See
FConfigFile::OverrideFromCommandlinefor implementation.
- See
You can do the same for CVars (still on non-shipping builds only) using the device profile cvar override parameter:
-DPCVars=r.cvarname=foo,anothercvar=bar.- Doesn't work for Cheat variables unfortunately.
If your game or editor freezes, a quick way to see what's wrong for people without Visual Studio on their computer is to run a Very Sleepy capture and check what
WinMainstack is doing.To use a memory stomp debugging memory allocator, start game with
-stompmallocTry to have your own errors and logs descriptive.
GetFullNameSafeis your friend.Don’t just null check if it’s not supposed to be null. Ensure or crash instead to find bugs faster. Have it automatically report all errors to the team for fast fixes.
Debuggers on Windows are limited to loading the symbols for 500 modules when attaching to a running process, less than UE has. It’s possible to increase the limit by adding the following registry key and rebooting the PC:
HKEY_LOCAL_MACHINE\SYSTEM\CurrentControlSet\Control\Session Manager-DWORD DebuggerMaxModuleMsgs = 2048. Source.You can force the engine to struggle/crash with the
debugconsole commands, good for testing crash reporting:debug gpf: Triggers a general protection fault (access violation).debug oom: Will continuously allocate 1MB per frame.- There are a lot of other things in there like
eatmem,stackoverflow,ensure,hitch, etc. CheckUEngine::PerformErrorfor more.
For debugging GPU issues:
- Set
r.RHISetGPUCaptureOptions 1to get more detailed GPU timings when runningProfileGPU(ctrl+shift+comma).- (is this automatic now?)
DumpGPUwill dump out all internal resources of a single frame for inspecting as an interactive html page. You can launch it to inspect the draw calls along with their internal buffers.- Run the engine with
-gpucrashdebuggingor-d3ddebug(don't use both at the same time). - Run with
-onethread -forcerhibypass. This will force UE to run with one thread only and will help to determine if the underneath problem is a threading/timing issue. - Run with
r.RDG.Debug=1which might give you information about render passes that have not been properly set. - Run with
r.RDG.ImmediateMode=1which will force the RenderGraph (RDG) to execute passes immediately after creation and can give you more meaningful callstacks (that actually changes other things under the hood and can be a red herring factory but it is still worth doing). - More in this UDN article if you have access.
- Check this great Unreal Fest presentation: GPU Crash Debugging in Unreal Engine: Tools, Techniques, and Best Practices | Unreal Fest 2023 (youtube.com)
- Set
Understand the differences of the four Build Configurations:
Debug Development Test Shipping Sets UE_BUILD_DEBUG=1Sets UE_BUILD_DEVELOPMENT=1Sets UE_BUILD_TEST=1Sets UE_BUILD_SHIPPING=1Debuggable in IDE Debuggable in IDE Debuggable in IDE Debuggable in IDE Code not optimized Code optimized Code optimized Code optimized Symbols copied to staged build Symbols copied to staged build Symbols copied to staged build Symbols not copied unless IncludeDebugFiles=trueConsole enabled Console enabled Console enabled No console unless ALLOW_CONSOLE_IN_SHIPPING=1Cheat Manager enabled Cheat Manager enabled Cheat Manager enabled No Cheat Manager unless UE_WITH_CHEAT_MANAGER=1Insights & Visual Logger enabled Insights & Visual Logger enabled Insights & Visual Logger enabled No Insights or Visual Logger unless UE_TRACE_ENABLED=1Slow and normal checks/ensures Normal checks/ensures No checks/ensures unless bUseChecksInShipping=true.No checks/ensures unless bUseChecksInShipping=trueLogging enabled Logging enabled No logging unless bUseLoggingInShipping=trueNo logging unless bUseLoggingInShipping=trueDebug drawing enabled Debug drawing enabled No debug drawing unless UE_ENABLE_DEBUG_DRAWING=1No debug drawing unless UE_ENABLE_DEBUG_DRAWING=1- You put defines (
ALL_CAPS=1) into theGlobalDefinitionsarray in your *.Target.cs file. You putbCamelNamedVars=truestraight into your *.Target.cs file. - ALL build configurations can be debugged in your IDE (Visual Studio, Rider, etc), but only if you have the Symbols for it.
Development,Test, andShippingconfigurations all have the same level of code optimizations applied to it.- The
DebugGame”configuration” usesDebugfor your game modules andDevelopmentfor engine modules. : Can be forced to be unoptimized: - Individual C++ files:
- Checked out (as in writable, when using P4) C++ files via adaptive unity builds
- BuildConfiguration.xml:
<BuildConfiguration><bAdaptiveUnityDisablesOptimizations>true</..>. - Target.cs:
bAdaptiveUnityDisablesOptimizations = true;.
- BuildConfiguration.xml:
- Checked out (as in writable, when using P4) C++ files via adaptive unity builds
- Per module:
- BuildConfiguration.xml:
<ModuleConfiguration><DisableOptimizeCode><Item>ModuleName</..>. - Build.cs:
OptimizeCode = CodeOptimization.InShippingBuildsOnlyorCodeOptimization.Never. - Target.cs:
DisableOptimizeCodeForModulesarray.
- BuildConfiguration.xml:
- For a block of code:
UE_DISABLE_OPTIMIZATION/UE_ENABLE_OPTIMIZATION.- These are not supposed to be shipped, it’s recommended you add the define
UE_CHECK_DISABLE_OPTIMIZATION=1in your continuous integration builds so you don’t accidentally ship with code unoptimized. - If a block of code is supposed to be shipped as unoptimized you can signal intention by using
UE_DISABLE/ENABLE_OPTIMIZATION_SHIP.
- These are not supposed to be shipped, it’s recommended you add the define
- Individual C++ files:
- You put defines (
You can set a hardware data breakpoints programmatically the hw_break library.
You can have a remote Imgui client showing debug values from your game with the UnrealNetImgui library. Good if you don’t want to clutter the game’s screen.
Profiling
- Check out Maximizing Your Game’s Performance in Unreal Engine.
- Check out The Great Hitch Hunt: Tracking Down Every Frame Drop.
- For info on the new Memory Profiling tools, check out New Features of Insights: Unreal Engine's Built In Profiling Tools.
- Check out Budgeting in a Post-Polycount World | Unreal Fest 2024.
- You’ll want to use Unreal Insights for most of your built-in profiling needs.
- First compile
UnrealInsightsproject (if running a source build) and launch it before you launch your game or editor. - Then launch your project with
-trace=default,memory,(and/or other channels you wish to profile)to start it in trace mode with the specified channels.- Some available trace channels are ,
CPU,GPU,Trace,Log,Task,Frame,LoadTime,File,Net,Memory,Bookmark.- See the Unreal Insights Reference documentation page for which channels you can enable.
- Use
-statnamedeventsto get more CPU telemetry functions reported. - By just providing
-traceor-trace=defaultit will default to-trace=cpu,gpu,frame,log,bookmark. - You can also create custom trace channel groups in
DefaultEngine.inivia:[Trace.ChannelPresets] MyChannelSet=log,frame - Search for
UE_TRACE_CHANNEL(orUE_TRACE_CHANNEL_DEFINEto see more channels to use. - Use the
Taskchannel for multithreaded profiling, then you can follow task dependency chains. Example on Twitter.
- Some available trace channels are ,
- Optionally use
-tracehost=addressif you want to send the trace to another computer doing the profiling.
- First compile
- For CPU sample profiling on Windows I really recommend Superluminal.
- When using Sampling profilers like Superluminal, you can add UE specific telemetry data alongside the sampling data using the
-Superluminalstartup parameter. Other supported ones are-PIX,-VTune,-VSPerf,-ConcurrencyViewer,-AQTime, and-Instrumentsfor Mac.- The game has to be compiled with superluminal profiling support, which only happens automatically if the building computer has Superluminal installed at the time of building (see Core.Build.cs and search for “Superluminal”).
- Use
SCOPED_NAMED_EVENTin any block of code to make it show up in the CPU profiler in Unreal Insights. - Use
TRACE_BOOKMARK(Format, Args)to make your own custom bookmarks that show up in Unreal Insights. - You can customize the colors on the timings shown in
stat unitby adding this to your DefaultEngine.ini (for 60fps):[/Script/Engine.RendererSettings] t.TargetFrameTimeThreshold=16.7 t.UnacceptableFrameTimeThreshold=33.9 - You can use
r.ScreenPercentageto lower the resolution to see if the pixel shader is what's taking up most of the GPU time, but it’s better to just get the actual numbers using Insights and the ProfileGPU command. - GPU profiling during development should be done with dynamic resolution disabled (
r.DynamicRes.OperationMode=0) for consistent numbers. - For profiling GPU:
r.RHISetGPUCaptureOptions 1is a shortcut for these three options:r.rhicmdbypass 1r.rhithread.enable 0r.showmaterialdrawevents -1profilegpu- See more at https://docs.unrealengine.com/shader-debugging-workflows-unreal-engine/
- GPU Profile now shows you draw cost per material. Not always accurate and desktop only but it's a great early test.” - Source: https://twitter.com/sirwyeth/status/1446566692998590466?s=21
Slate / UMG
- Check out ben🌱ui’s Intro on UIs.
- Use Widget reflector for debugging the state of UMG/Widgets.
- UMG’s Bind buttons aren’t actual binds, they just check the property every frame which is inefficient. Instead disable the
Bindbutton viaProject Settings→Editor→Widget Designer (Team)→Compiler→Default Compiler Options→Property Binding Rule→Prevent and Error, and use events or View Model instead. - Use the
BindWidgetUPROPERTYto set up child Widget C++ property access. - Widgets'
PreConstructevent has a "Design Time" flag, used to create mock data for easier UI design and testing in editor. - Widgets with
FastPathenabled add a bunch of pre-warmed UObjects to memory, make sure to only have widgets loaded if you're actually displaying them or about to.
Garbage Collection
- Destroyed actors don’t have references to them nulled until they’re actually garbage collected. That's what
IsValidis used for checking. - A
UObject’s references will all get cleared by the GC after itsDestroyis called and before itsBeginDestroyandEndPlayare called. - Containers (
TArrayand others) ofUObjectpointers also don’t get items nulled unless they’re marked withUPROPERTY. - Self review before committing: All
UObject(includes actors) class member references or containers containing them should be marked withUPROPERTY. - Try to avoid spawning lots of
UObjectswith short lifetimes. If you do consider putting them into a GC cluster to reduce garbage collection overhead. (Edit: GC clusters aren’t that much of a perf saving after all) - When calling
Collector.AddReferencedObjectsmanually remember to always includethisas the second parameter for GC debugging.- But I’d say don't call that function at all and instead use GC aware properties or containers in
UPROPERTY, useTransientif you don't want it to get serialized.
- But I’d say don't call that function at all and instead use GC aware properties or containers in
MarkPendingKillsets a flag which will be used during garbage collection reference traversal when objects are being marked reachable. If a reference points to an object that has been marked asPendingKillit will null the property instead of considering the object reachable. The object being left as unreachable is what will eventually purge it at the end of a GC run.
Memory
- “Object count” in the upper right corner of the editor is the count of every
UObjectin your game.Editor Preferences→General→Performance→Show Frame Rate and Memoryto turn that on.- If it keeps growing, use
obj list forget,obj listto see what objects are currently being created. obj list class=xto see full names of each object of that class (still respects the forget command).obj refs name=/full/name/of/item.item shortestto see why it’s alive (or see ‣ if nothing is referencing it).
memreportandmemreport -fullcan be customized inDefaultEngine.ini viain the[MemReportCommands]and[MemReportFullCommands]categories. SeeBaseEngine.inifor the default commands.- Unreal Insights has a full-stack per-allocation tracking. See more in my presentation Maximizing Your Game’s Performance in Unreal Engine.
- You can force Unreal to use a specific memory allocator by supplying one of these at startup for non-shipping builds. See more in
EMemoryAllocatorToUseandFWindowsPlatformMemory::BaseAllocator(or any of the other platform memory classes’BaseAllocatorfunction).-ansimalloc: Use the ANSI C memory allocator. Skips using Unreal’s binned memory and gets allocations directly from the OS. Handy if you want to use an external memory profiling tool that isn’t Unreal Insights. It’s slower though, and can cause memory fragmentation. AddGlobalDefinitions.Add("FORCE_ANSI_ALLOCATOR=1");to your Target file to force it always on in all builds including shipping.-binnedmalloc,-binnedmalloc2,-binnedmalloc3: Unreal’s binned memory allocators. These are used by default when possible. Binned1 is the old one, Binned2 newer one, and-binnedmalloc3is the newest VM-based one that’s used for 64 bit systems. Unreal will always use the best one for each platform, you shouldn’t need to manually override these.-stompmalloc: Debugging memory allocator that throws exceptions if it detects the code stomping over memory it has marked. Takes a lot more memory and is much slower. Only available on desktop platforms.- Check
BaseAllocatorfunctions for other rarer allocators.
Tooling
- There are a few ways of setting cvars:
- At runtime, in the console:
cvarname 0- You can chain multiple console commands together with the
|character.
- You can chain multiple console commands together with the
- As an editor startup parameter:
-DPCVars=”cvarname=0,othercvar=2” - In
DefaultEngine.inifor setting it on every launch:[SystemSettings] s.EnforcePackageCompatibleVersionCheck=0- There is a way of using
ConsoleVariables.inifor engine wide changes but it's bad practice in my opinion since it affects all projects using that engine and might accidentally get checked in, don't do it.
- There is a way of using
- At runtime, in the console:
- To call any command on engine launch, start it with
-ExecCmds=”Command1,command2”.- There is also a
-EXEC=that apparently wants a filepath, which it will run with exec (an Unreal command line command), which interprets the given file as new-line delimited commands. - These happen a bit later in the startup process, might not happen early enough for some purposes.
- You can use it for setting cvars but
-DPCVarssyntax is better as it happens earlier in the startup flow.
- There is also a
- You can set an environmental variable,
UE-CmdLineArgs, which appends command line arguments to all UE processes. Only in non-shipping (editor only?) - For non-desktop platforms like mobile and consoles, you can set the startup command line by populating the
UECommandLine.txtfile. - Have your CI compile all blueprints:
UE4Editor-Cmd.exe "AbsolutePath_to_.uproject" -run=CompileAllBlueprints -IgnoreFolder=/Game/Developers(won't compile level blueprints though). - Use "Editor Utility Tasks" for long running Blutilities that won't block your editor. Create a new
Editor Utility Blueprintthat extendsEditorUtilityTask, overrideBeginExecution, and callFinishExecutingTaskat the end. Instructions with pictures.- You can trigger these tasks in BP using
RegisterAndExecuteTaskinEditorUtilitySubsystem.
- You can trigger these tasks in BP using
- The editor doesn't collect garbage automatically, only on some actions like saving maps. If your tools are opening and touching on lots of assets remember to manually call the garbage collector every once in a while so the editor doesn't OOM.
- Don't use
GEngine->ForceGarbageCollection, it only tells the GC to collect on the next frame. For long running operations no frames are ticking, so you can instead force an immediate garbage collection by callingCollectGarbage(GARBAGE_COLLECTION_KEEPFLAGS). - Garbage Collection in the editor doesn’t do much. The editor automatically adds a flag to all assets to never collect them.
- Don't use
- Since 4.26 you can extend editor menus and toolbars using Blueprints. Instructions with pictures.
- You can automatically run any Blueprint's
Runfunction on editor startup by registering it inDefaultEditorPerProjectUserSettings.ini:[/Script/Blutility.EditorUtilitySubsystem] +StartupObjects=/Game/Editor/BP_YourBlutility - There's a commandlet called
DiffAssetsCommandlet, with a commandExportFilesToTextAndDiff. Do with that what you will 🤷♂️.
Version Control
- Unreal has a blueprint diffing tool built into the editor, which you can also launch directly from the command line. Use it as the diff viewer for *.uasset files directly from your version control client.
UnrealEngine.exe [Uproject path] -diff [options] left rightfor diffing.leftandrightare file paths.UnrealEngine.exe [Uproject path] -diff [options] remote local base resultfor merging.- See
EditorCommandLineUtilsImpl::RunAssetDiffCommandfor more info. - If you’re using Plastic SCM for source control check out this page.
- Nice quick intro on using Perforce on a UE project.
- PerforceU’s catalogue is mostly UE related: https://perforceu.perforce.com/catalogue
- Git is not a good version control for Unreal projects. Here's why.
- You can enable cross-branch locking in Perforce using this plugin.
Input
- Always use bindings, never query buttons directly.
- The
Enhanced Input Pluginis now the recommended way of handling input in Unreal, check it out if you haven’t already.
Level Streaming
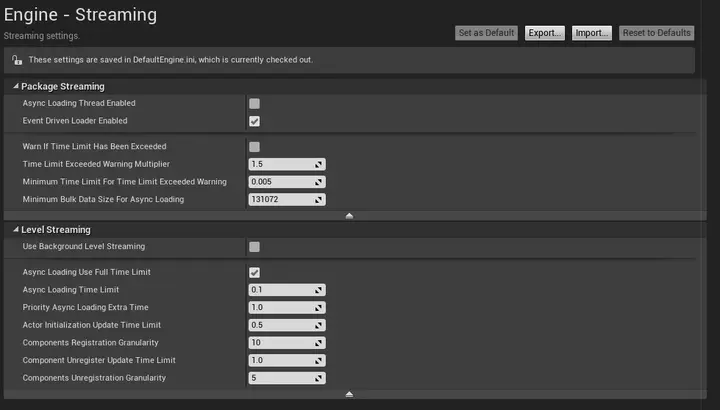
Frame budgets for level streaming are extremely customizable, check UDN thread.
Always use
EndPlayinstead ofUnloadEventfor gameplay logic. If you ever disable the cvars.ForceGCAfterLevelStreamedOutto remove hitches on level unloads then that will delay level unloading until the GC runs instead of immediately.UnloadEventonly gets called when the level actually unloads, so with the cvar disabled it can happen up to a minute later, basically whenever the GC decides to run. Just usingEndPlayto clean up gets around that problem.s.ForceGCAfterLevelStreamedOutis off by default when using World Partition.
BeginPlayandEndPlaycan be called multiple times during an object's lifetime as a level is being shown/hidden if you're doing it yourself manually viaULevelStreaming.
World Partition
- To turn on debug streaming grid:
wp.Runtime.ToggleDrawRuntimeHash2D- It shows level 0 by default, you can change the grid level with
wp.Runtime.ShowRuntimeSpatialHashGridLevel <level_number> - You can also show multiple grid levels at once with
wp.Runtime.ShowRuntimeSpatialHashGridLevelCount <level_count>
- It shows level 0 by default, you can change the grid level with
Multiplayer
Check out Multiplayer Network Compendium | An Unreal Engine Blog by Cedric Neukirchen (cedric-neukirchen.net) and Unreal Engine Multiplayer Tips and Tricks - WizardCell.
Keep in mind
- Users can start a Play-In-Editor (PIE) session before Asset Registry has finished asset discovery. If you're using Primary Assets and/or trying to query/load the asset registry early on in your game it might not be populated yet in the editor (packaged builds don’t have this problem, they’ll load the asset registry synchronously before starting the game). Query the asset registry's loading status on your game start in editor only to force a wait there if that happens.